

AI Infographic Generator

Choose a template to add its sample as a reference image. Enter the content you want to show, then generate your infographic.

Create infographics with Raphael AI. Choose a reference sample from 30 templates, enter your subject, text, and data, and generate timelines, comparisons, process guides, and visual explanations.

Reference Images (Optional)
0 / 3,000
AI Enhance
Model
Aspect Ratio
Output Number
Resolution
Quality
Fast

Infographic Templates for Your Ideas

Explore 30 layouts, from illustrated lists and timelines to comic explainers and research summaries. The examples show how different subjects can look.

Turn notes into visual explanations

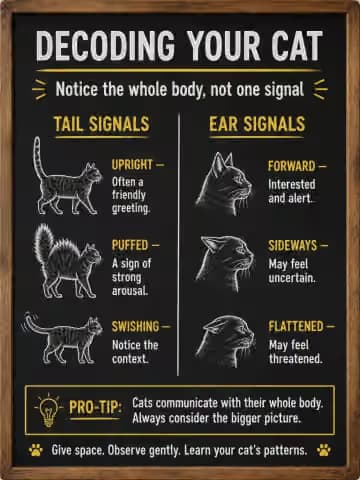
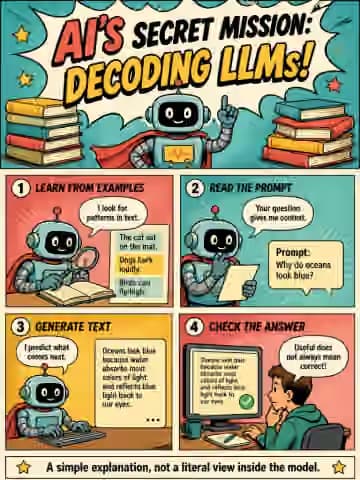
Organize a method in a cheat sheet or explain a concept through a comic. Choose a template and enter your study notes, training points, or AI tool tips, then generate an infographic for a lesson, blog, or social post.
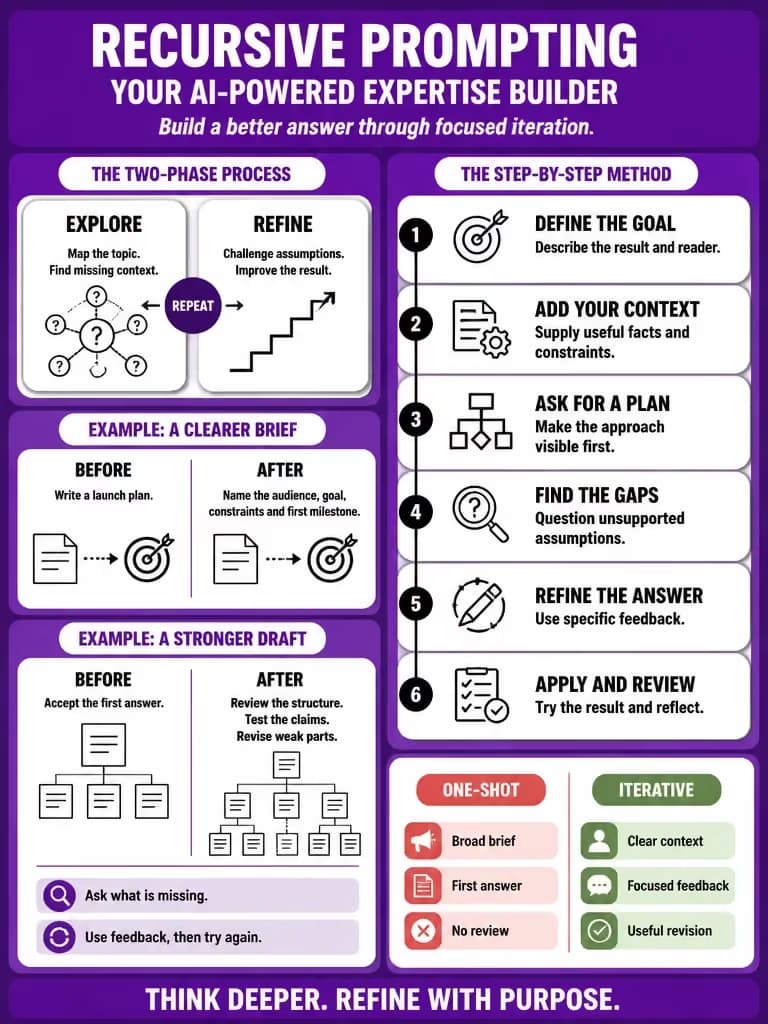
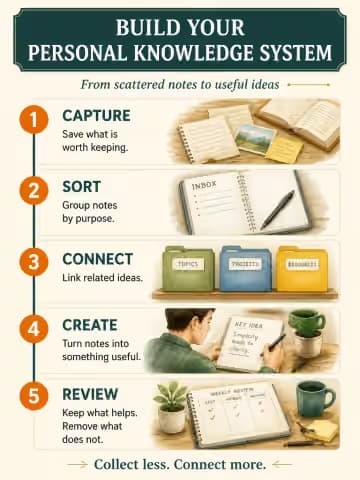
Recursive prompting — Modular cheat sheet
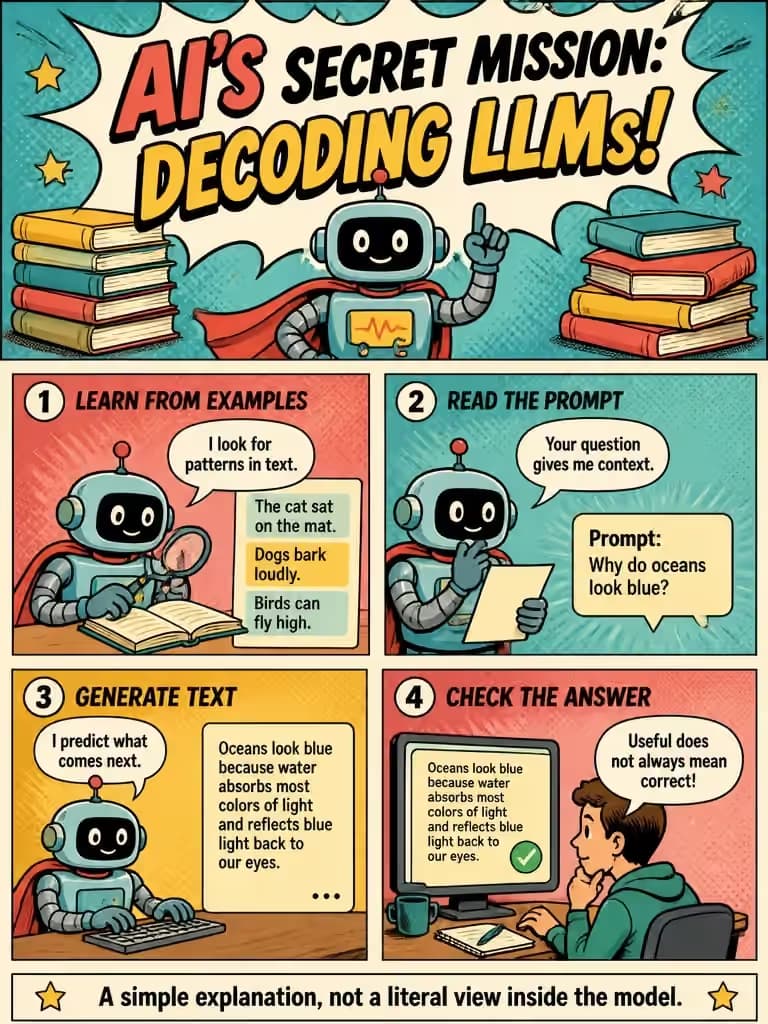
How large language models work — Storyboard explainer

Show the steps and priorities

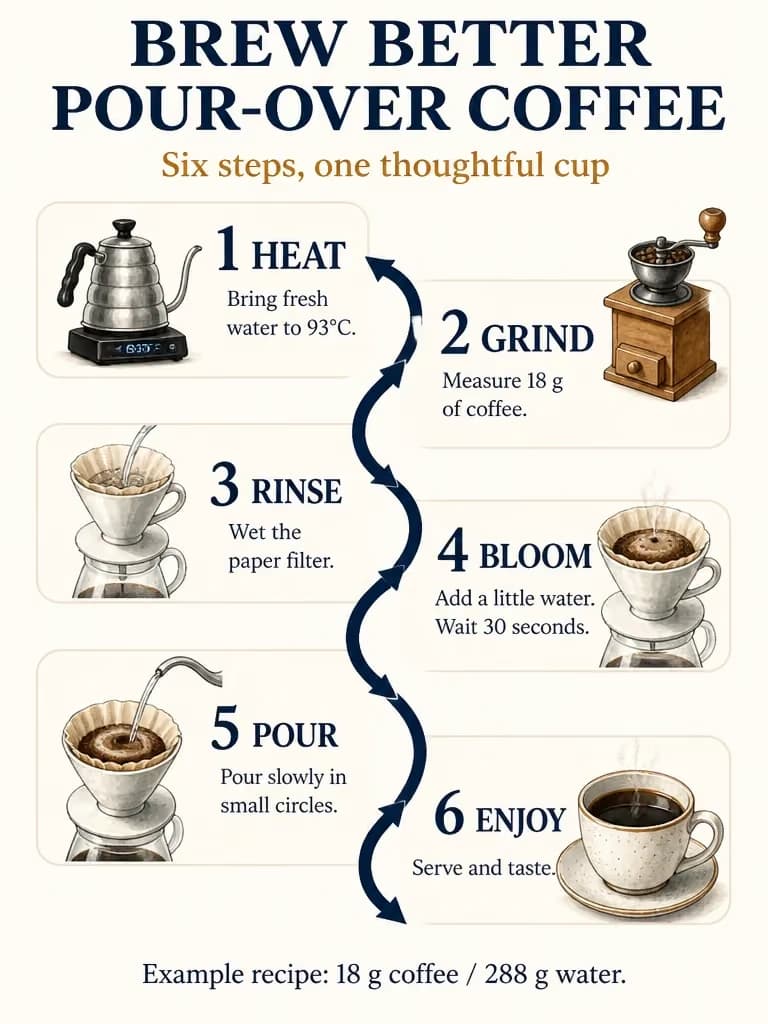
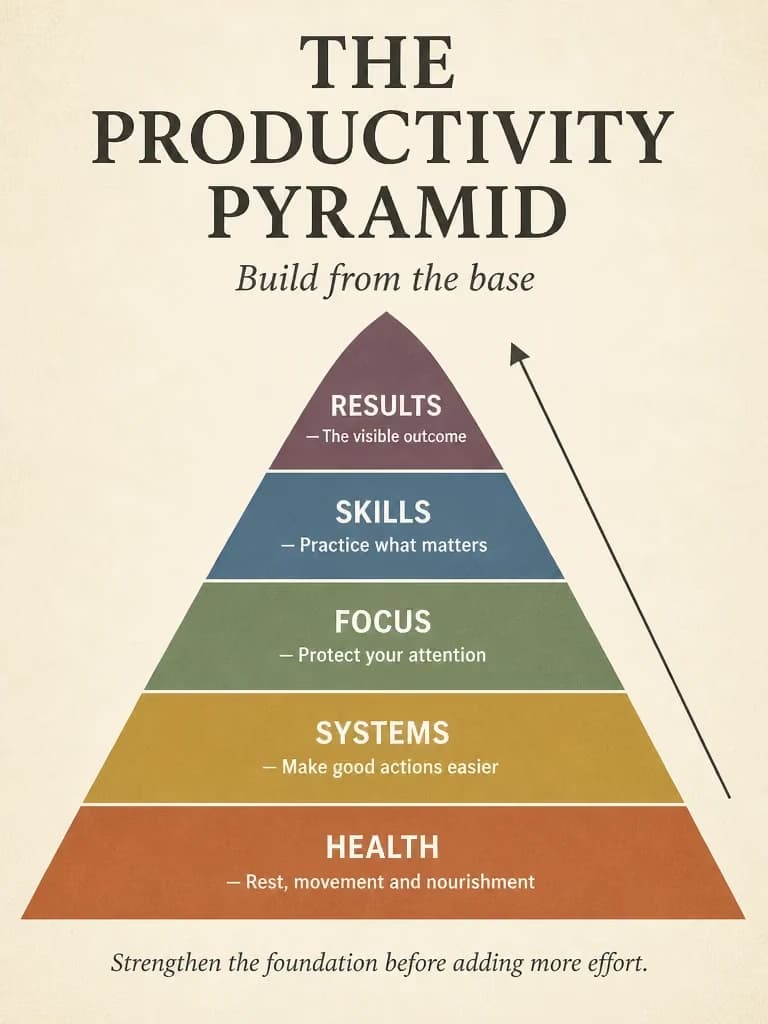
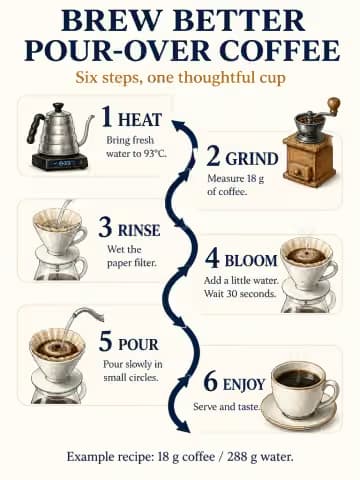
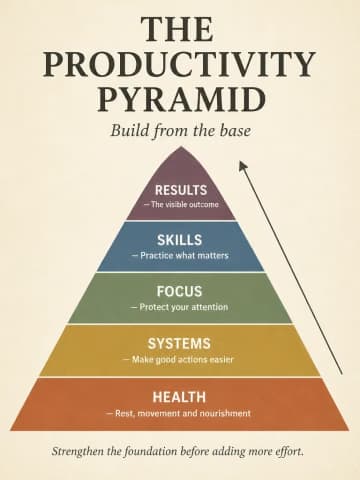
Explain a process with numbered steps and arrows, or use a pyramid to show how ideas build on each other. These infographic templates suit tutorials, onboarding instructions and learning frameworks. Include the actual steps and their order to make the guide specific to your task.

Pour-over coffee — Flowchart
The productivity pyramid — Pyramid diagram

Summarize research and technical systems

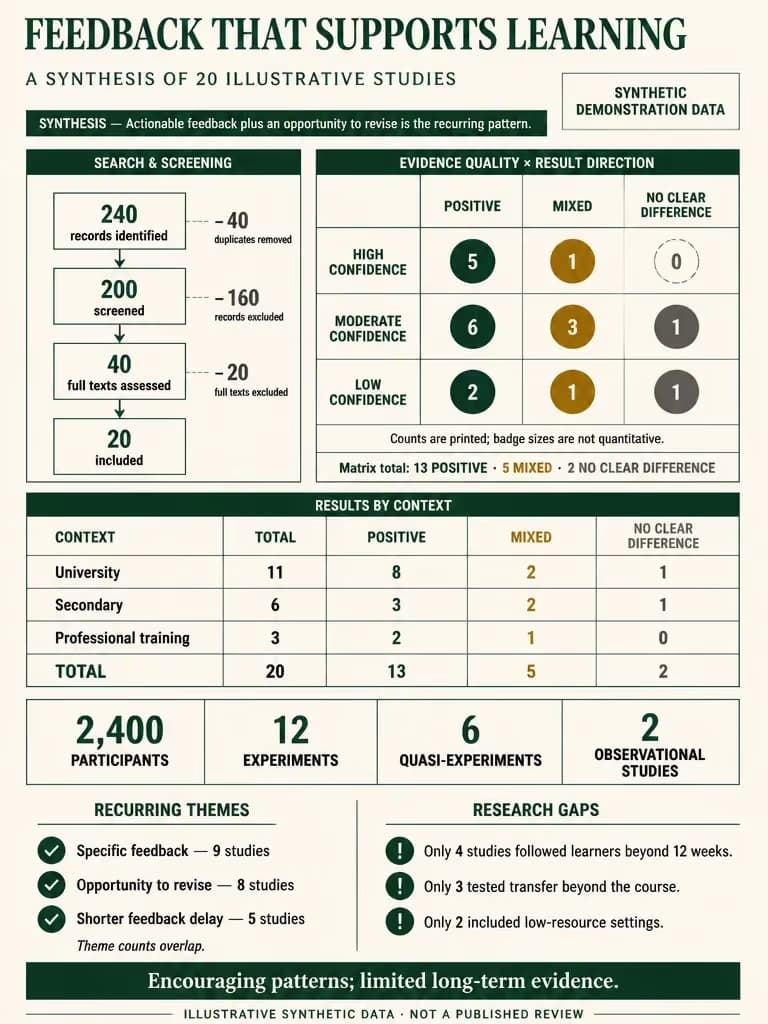
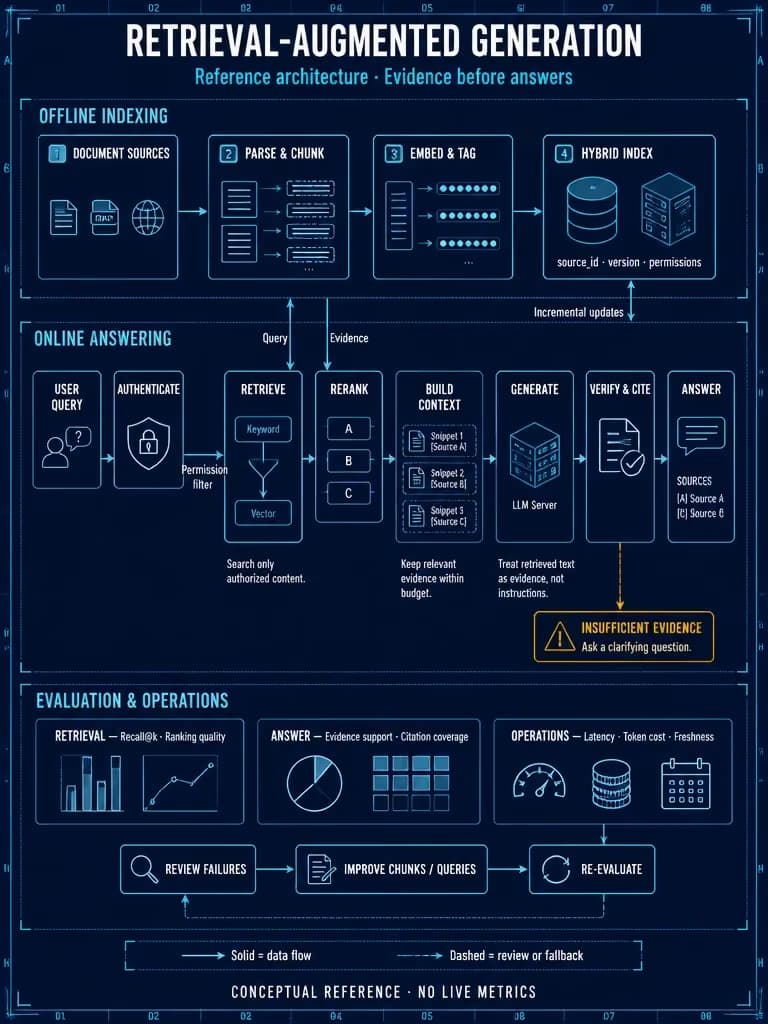
Bring your study findings, experiment results or architecture notes together in one image. Evidence maps and system diagrams can help readers follow a review or see how components connect. Supply the figures, labels and sources you want shown, then check the generated text and diagrams before sharing.

Feedback and learning — Evidence synthesis
Retrieval-augmented generation — System architecture

Make plans and reviews easier to present

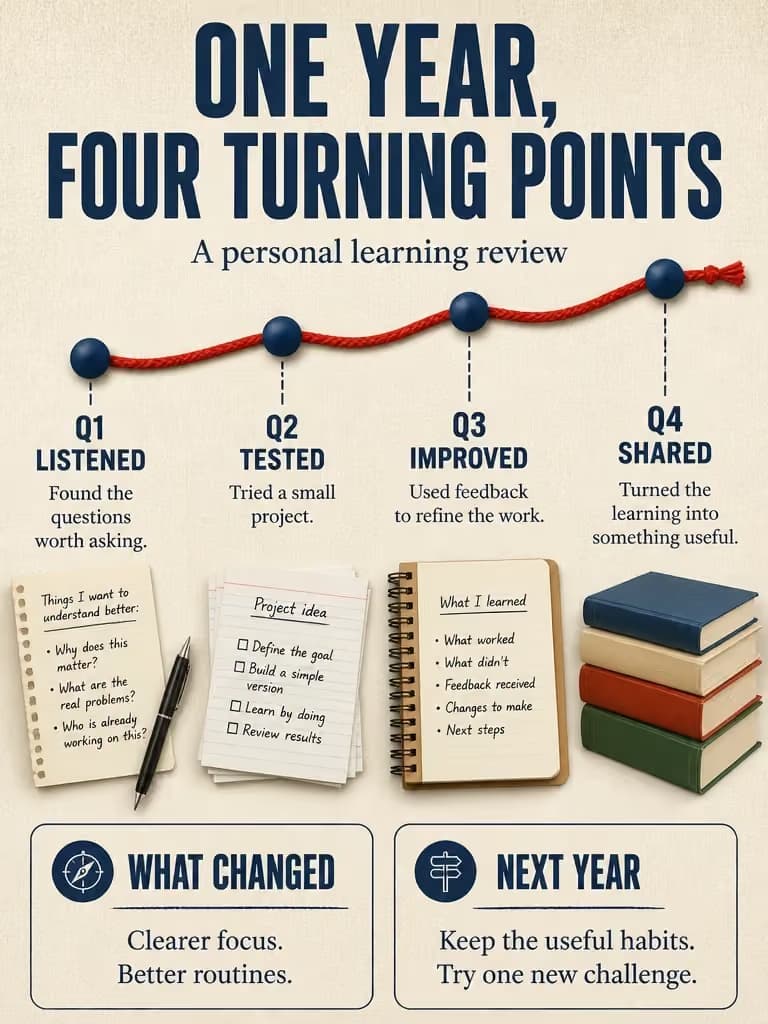
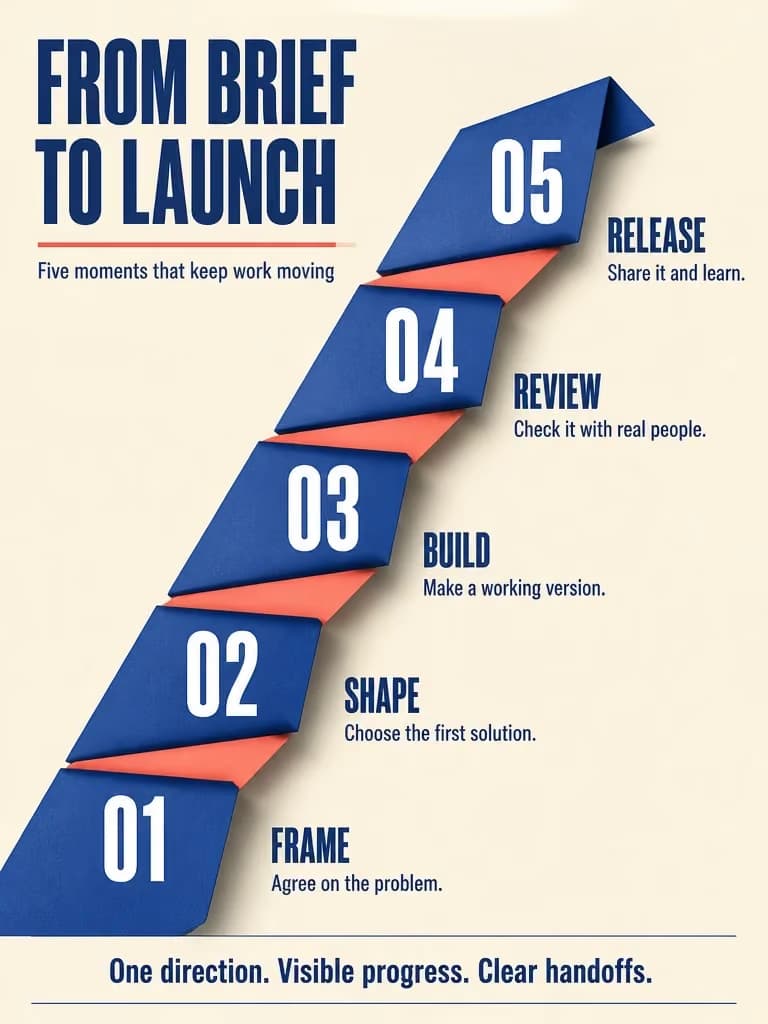
Turn project milestones into a roadmap or summarize a year of progress. Enter dates, achievements, and next steps for a team meeting or personal plan. Switching templates keeps the content you entered.

A year of growth — Milestone review
From idea to launch — Roadmap

Create visual guides for everyday topics

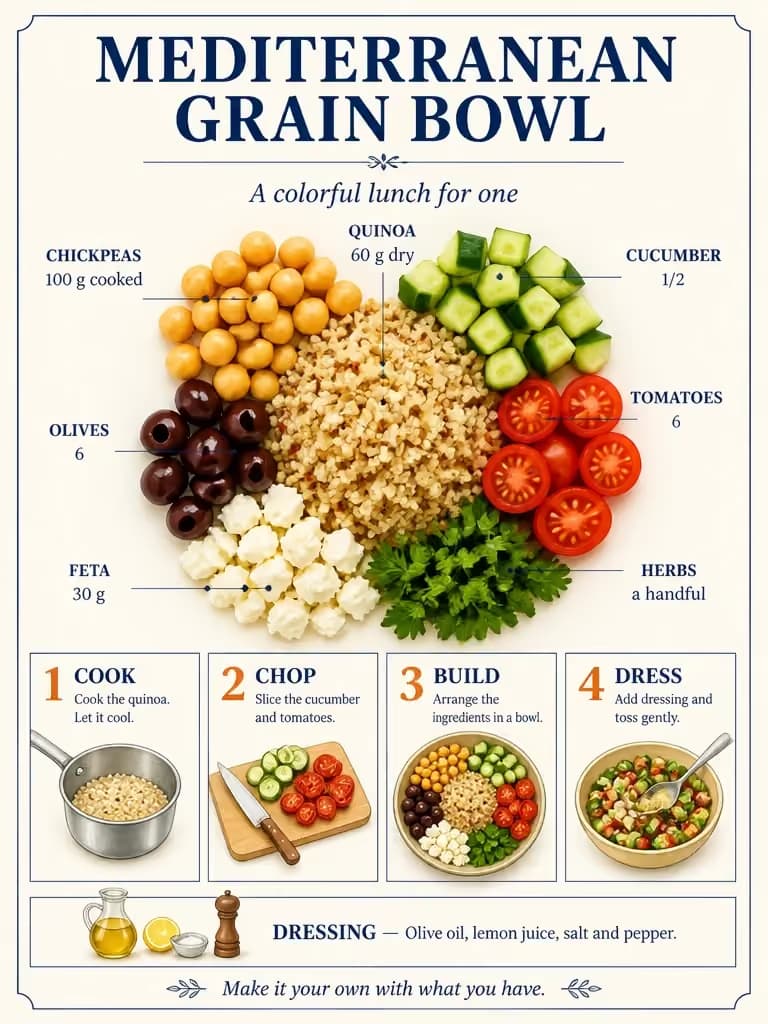
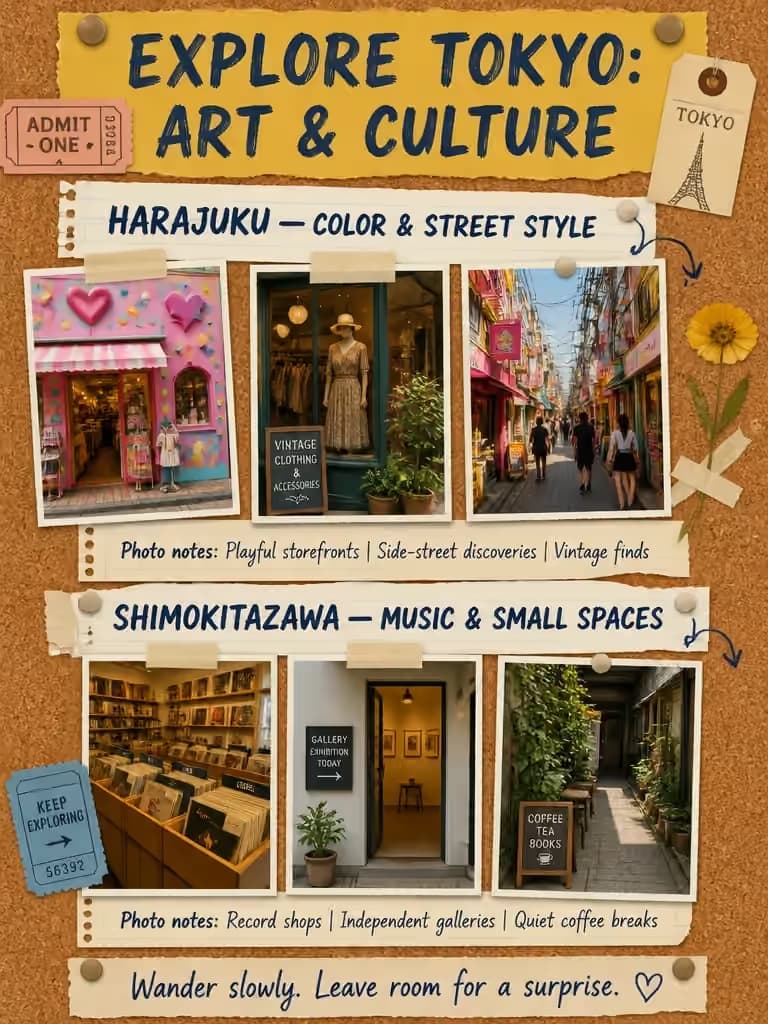
Present ingredients and cooking steps in a recipe infographic, or collect travel ideas in a photo collage. Describe the subject, key points and mood you want. Illustrated guides and distinctive styles give you options for personal projects, newsletters and social posts.

Mediterranean grain bowl — Component breakdown
Tokyo art and culture — Grouped photo collection

Infographic templates

How to Create an Infographic with AI

Choose a template, enter your content, and generate an infographic to download.

  1. List infographic
    List infographic
    Step-by-step guide
    Step-by-step guide
    Flowchart
    Flowchart
    Pyramid diagram
    Pyramid diagram
    Category diagram
    Category diagram
    Storyboard explainer
    Storyboard explainer

    Choose an infographic template

    Choose a list, timeline, comparison, or visual style. Its sample is automatically added as a reference image.

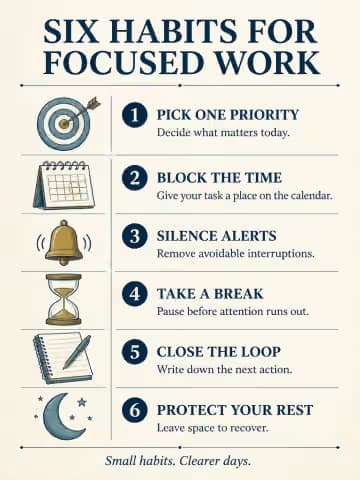
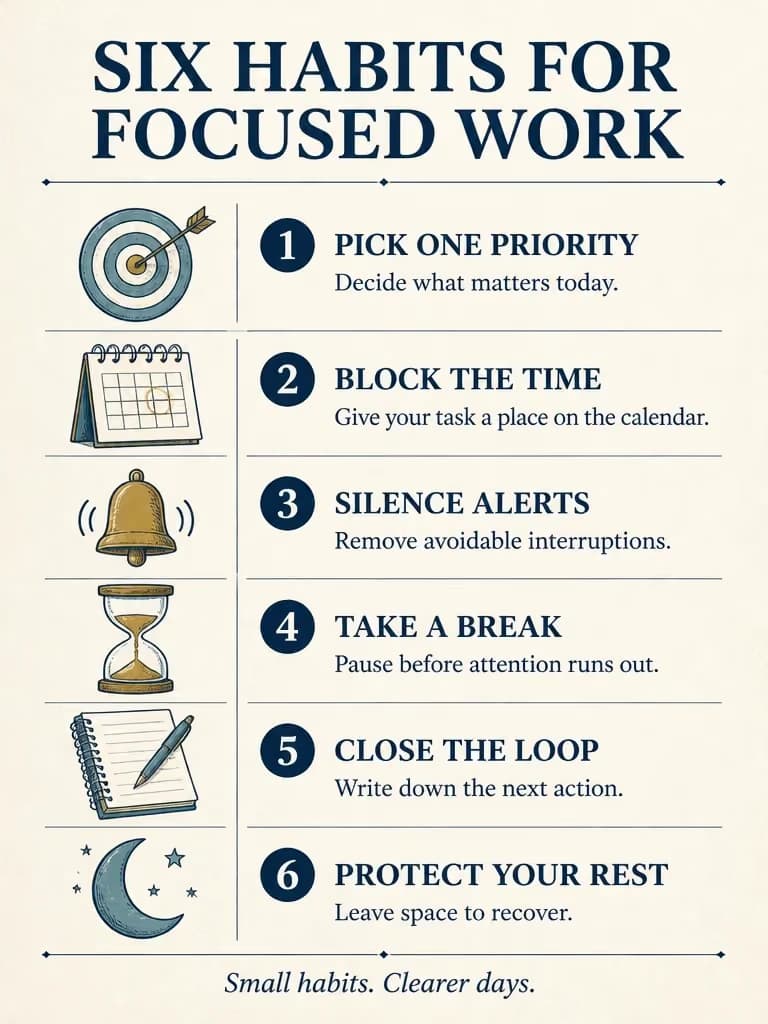
  2. Six habits for focused work
    Prompt
    Make a checklist for better focus

    Enter the content you want to show

    Enter your subject, title, text, steps, or data. The system uses the sample layout and style as a reference. Specify a different text language in your content if needed.

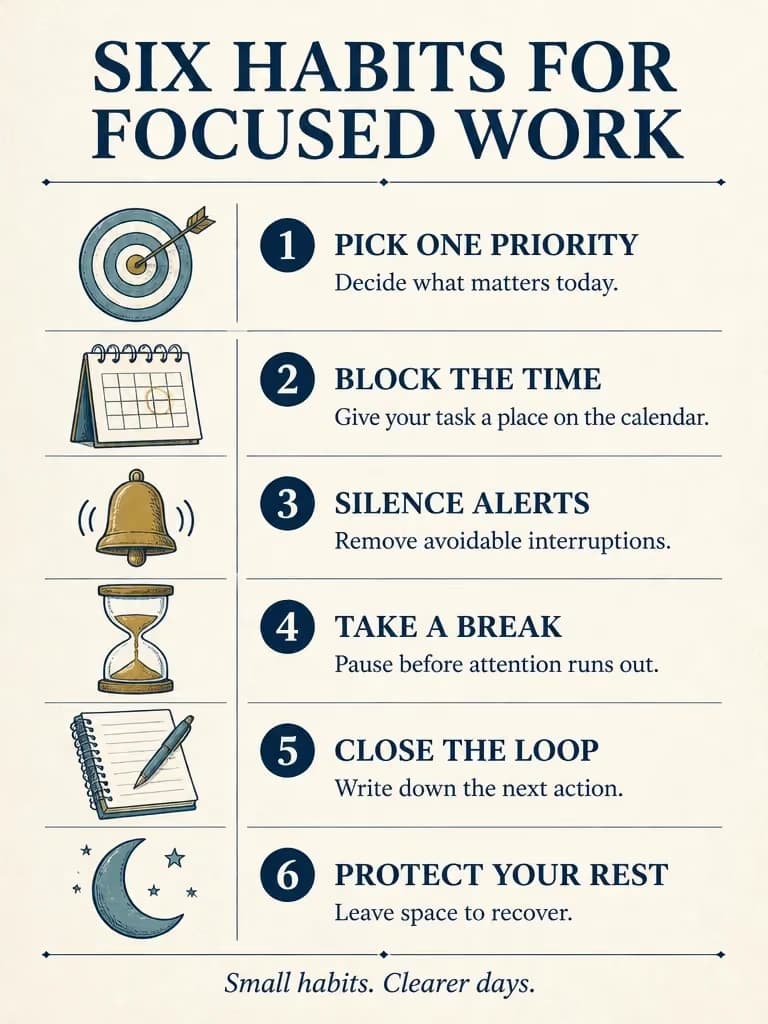
  3. Six habits for focused work

    Generate and review

    Choose a model, check the aspect ratio, resolution and quality, then review the button’s credit amount and generate. Check the image’s text and figures before downloading.

From Text to Infographic, with a Layout in Mind

Use a sample to guide the visual style, enter your own content, and choose generation settings.

30 infographic templates

Choose illustrated lists, timelines, comparisons, process guides and styles such as comics, chalkboards and collages.

Enter your own content

No need to edit a long template prompt. Enter your subject, key points, and text; the system adds a short reference-image instruction when submitting.

Your notes and data

Provide your own notes, data, units, dates, and context for the infographic.

Switch samples and keep your content

Selecting another template replaces the reference sample and sets its aspect ratio while keeping the content you entered.

Flexible image dimensions

Choose the aspect ratio, resolution and generation quality for a social post, presentation illustration or learning handout.

Downloads and history

Download the generated image or restore the original input and settings from history to make another version.

AI Infographic Generator FAQ

Answers about templates, input, downloads and making changes.

1

What kinds of infographics can I create?

Create lists, how-to guides, comparisons, timelines, cycle diagrams, pyramids, roadmaps and research summaries. The 30 templates also include comic, chalkboard, museum exhibit and collage styles. Choose a structure that fits your content.

2

How do I generate an infographic from text?

Choose a template to add its sample as a reference image. Enter your subject, text, and data, choose a model and generation settings, then submit. You can also write a prompt without selecting a template.

3

Will the template example appear in my infographic?

The sample guides the layout, colors, and illustration style; its original prompt is not inserted into the input. The system instructs the model to replace sample text and data with your content. Review the generated result for accuracy.

4

Can I edit the text after generation?

The result is a complete image. Restore your content and settings from history, edit them, and generate again. Switching templates keeps the content you entered.

5

Can I use my own research or data?

Yes. Enter your own findings, figures, units, and source labels. Check the result against your sources before using it in a report, including the accuracy of generated charts and illustrations.

6

Can I use the images in social posts or presentations?

You can download a generated image and place it in a social post, blog, presentation or teaching material. Choose an aspect ratio and resolution suitable for where the image will appear, and check that small text is readable.

7

Do I need design skills or a detailed prompt?

No. Choose a reference sample and enter the content you want to show. The system adds a short reference-image instruction; the complete submission still follows the selected model’s length limit.

8

How much does it cost to generate an infographic?

The selected image model’s existing pricing applies. The Generate button shows credits for your content and settings. The system adds a short reference-image instruction at submission; check the amount after changing your content, model, or settings.

Raphael AI

Give Your Next Idea a Visual Form